In the March 2020 Bank Watch, we provided our first impressions of the “reshaping landscape” created by the COVID-19 pandemic and its unfolding economic consequences.This month, we expand upon the potential asset quality implications of the current environment.
One word that aptly describes the credit risk environment is inchoate, which is defined as “imperfectly formed or formulated” or “undeveloped.”We can satiate our analytical curiosity daily by observing trends in positive COVID-19 cases, but credit quality concerns created by the pandemic and its economic shocks lurk, barely perceptible in March 31, 2020 asset quality metrics such as delinquencies or criticized loans.However, the pandemic’s effect on bank stock prices has been quite perceptible, with publicly-traded bank stocks underperforming broad-market benchmarks due to concerns arising from both asset quality issues and an indefinite low interest rate environment.Bridging this gap between market perceptions and current asset quality metrics is the focus of this article.
At the outset, we should recognize the limitations on our oracular abilities.Forward-looking credit quality estimates now involve too many variables than can comfortably fit within an Excel spreadsheet—case rates, future waves of positive diagnoses, treatment and vaccine development, and governmental responses.The duration of the downturn, however, likely will have the most significant implications for banks’ credit quality.
We neither wish to overstate our forecasting capacity nor exaggerate the ultimate loss exposure.We recognize that transactions are occurring in the debt capital markets involving issuers highly exposed to the pandemic’s effects on travel and consumption—airlines, cruise operators, hotel companies, and automobile manufacturers.Investors in these offerings exhibit an ability to peer beyond the next one or two quarters or perhaps have faith that the Fed may purchase the issue too.
To assess the nascent credit risk, our loan portfolio analyses augment traditional asset quality metrics with the following:
- Experience gleaned from the 2008 and 2009 Great Financial Crisis
- Collateral and industry concentrations in banks’ loan portfolios
“The World Breaks Everyone and Afterward Many Are Strong in the Broken Places”
A Farewell to Arms (1929) by Ernest Hemingway, which provides the preceding quotation, speaks to a longing for normality as the protagonist escapes the front lines of World War I.While perhaps a metaphor for our time, the quotation—with apologies to Hemingway—also fits the 2008 to 2009 financial crisis (“the world breaks everyone”) and uncertainties regarding banks’ preparedness for the current crisis (will the industry prove “strong in the [formerly] broken places”?).
To simulate credit losses in an environment marked by a rapid increase in unemployment and an abrupt drop in GDP, analysts are using the Great Financial Crisis as a reference point.Is this reasonable?Guardedly, yes; in part because no preferable alternatives exist.But how may the current crisis develop differently, though, in terms of future loan losses?
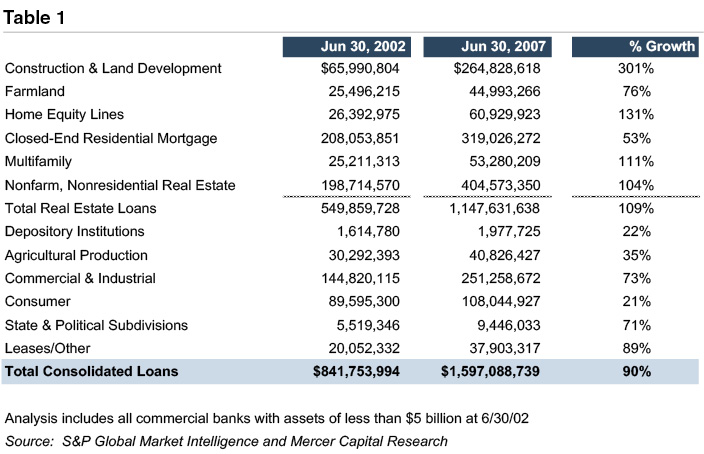
Table 1 presents aggregate loan balances for community banks at June 30, 2002 and June 30, 2007, the finalperiod prior to the Great Financial Crisis’ onset.One evident trend during this five year period is the grossly unbalanced growth in construction and development lending, which led to outsized losses in subsequent years.Have similar imbalances emerged more recently?
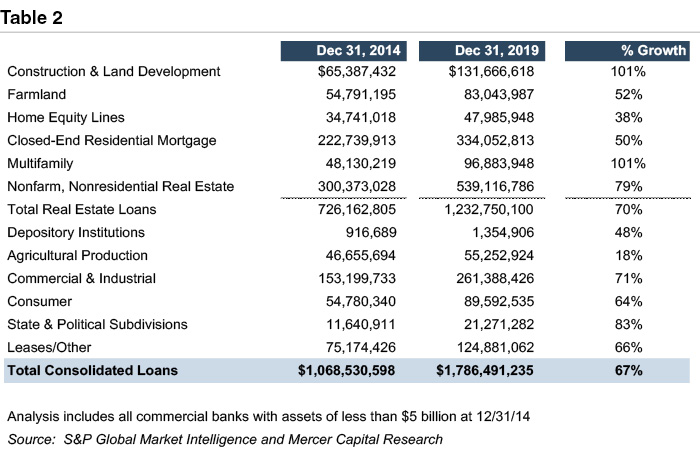
We can observe in Table 2 that loans have not increased as quickly over the past five years as over the period leading up to the Global Financial Crisis (67% for the most recent five year period, versus 90% for the historical period).Further, the growth rates between the various loan categories remained relatively consistent, unlike in the 2002 to 2007 period.The needle looking to pop the proverbial bubble has no obvious target.
Using the same data set, we also calculated in Table 3 the cumulative loss rates realized between June 30, 2008 and June 30, 2012 relative to loans existing at June 30, 2008.
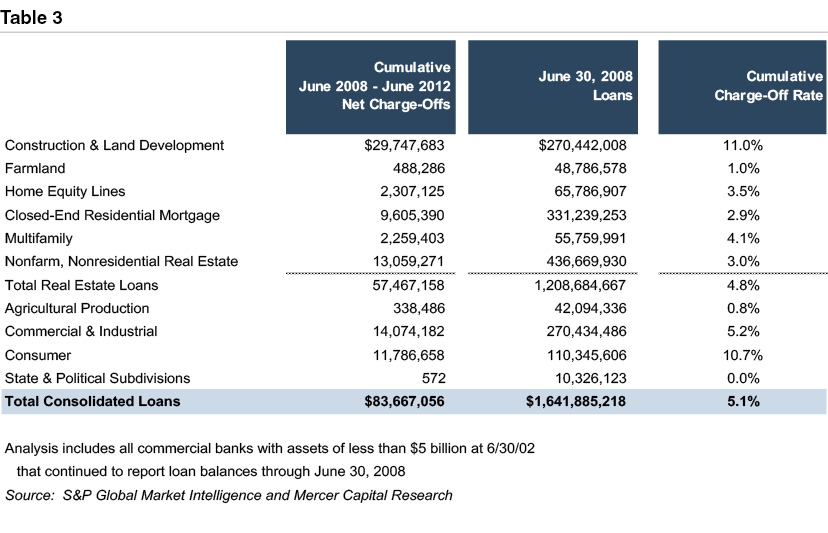
This analysis indicates that banks realized cumulative charge-offs of 5.1% of June 30, 2008 loans, although this calculation may be understated by the survivorship bias created by failed banks.The misplaced optimism regarding construction loans resulted in losses that significantly exceeded other real estate loan categories.Consumer loan losses are exaggerated by certain niche consumer lenders targeting a lower credit score clientele.
Are these historical loss rates applicable to the current environment?Table 4 compares charge-off rates for banks in Uniform Bank Performance Report peer group 4 (banks with assets between $1 and $3 billion).Loss rates entering the Great Financial Crisis and the COVID-19 pandemic are remarkably similar.
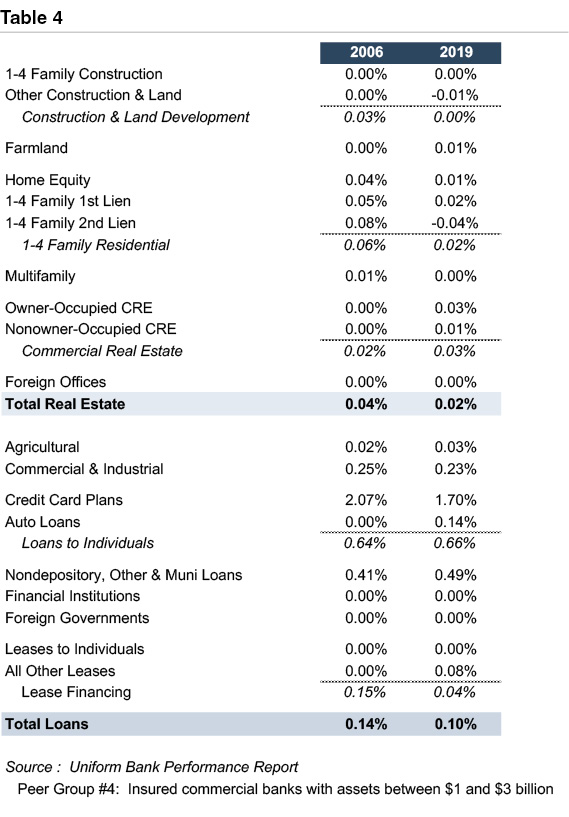
We would not expect the disparity in loss rates between construction and development lending versus other real estate loan categories to arise again (or at least to the same degree).Community banks generally eschew consumer lending; thus, consumer loan losses likely will not comprise a substantial share of charge-offs for most community banks.For consumer lending, the credit union industry likely will experience greater fall-out if unemployment rates reach the teens.
Regarding community banks, we have greater concern regarding the following:
- Commercial and industrial lending. Whether due to business opportunities or regulatory pressure to lessen commercial real estate concentrations, we have observed shifts in portfolios in favor of C&I lending and are uncertain regarding the maintenance of underwriting standards.Some evidence also exists that C&I loan losses were increasing prior to the crisis, although the impact appeared episodic.
- Commercial real estate. While we can claim no originality, our analyses currently emphasize borrower and collateral types to identify sectors more exposed to COVID-19 countermeasures.We recognize, though, that this can obscure important distinctions.For example, hotels reliant on conference attendance likely are more exposed than properties serving interstate highway stopovers.Further, we expect that the pandemic will alter behavior, or accelerate trends already underway, in ways that affect CRE borrowers, whether that is businesses normalizing Zoom calls instead of in-person meetings or consumers shifting permanently from in-store to on-line shopping.
In the Great Financial Crisis, banks located in more rural areas often outperformed, from a credit standpoint, their metropolitan peers, especially if they avoided purchasing out-of-market loan participations.This often reflected a tailwind from the agricultural sector.It would not be surprising if this occurs again.Agriculture has struggled for several years, weeding out weaker, overleveraged borrowers. Additionally, to the extent that the inherent geographic dispersion of more rural areas limits the spread of the coronavirus, along with less dependence on the hospitality and tourism sectors, rural banks may again experience better credit performance.
“They fancied themselves free, and no one will ever be free so long as there are pestilences.”
The Plague (1947) by Albert Camus describes an epidemic sweeping an Algerian city but often is read as an allegorical tale regarding the French resistance in World War II.Sales of The Plague reportedly have tripled in Italy since the COVID-19 pandemic began, while its English publisher is rushing a reprint as quarantined readers seek perspective from Camus’ account of a village quarantined due to the ravaging bubonic plague.
As Camus observed for his Algerian city, we also suspect that banks will not be free of asset quality concerns so long as COVID-19 persists.Another source of perspective regarding the credit quality outlook comes from the rating agencies and SEC filings by publicly-traded banks:
- Moody’s predicts that the default rate for speculative grade corporate bonds will reach 14.4% by the end of March 2021, up from 4.7% for the trailing twelve months ended March 31, 2020.This represents a level only slightly below the 14.7% peak reaching during the 2008 to 2009 financial crisis.1
- Fitch projects defaults on institutional term loans to reach $80 billion in 2020 (5% to 6% of such loans), exceeding the $78 billion record set in 2009.2
- Borrowers representing 17% of the commercial mortgage-backed security universe have contacted servicers regarding payment relief.Loans secured by hotel, retail, and multifamily properties represent approximately 75% of inquiries.Fitch also questions whether 90-day payment deferrals are sufficient.3
- Delinquent loans in commercial mortgage backed securities are projected to reach between 8.25% and 8.75% of the universe by September 30, 2020, approaching the peak of 9.0% reported in July 2011.4The delinquency rate was 1.3% as of March 2020.Fitch identified the most vulnerable sectors as hotel, retail, student housing, and single tenant properties secured by non-creditworthy tenants.Among these sectors, Fitch estimates that hotel and retail delinquencies will reach approximately 30% and 20%, respectively, relative to 1.4% and 3.5% as of March 2020.The prior recessionary peaks were 21.3% and 7.7% for hotel and retail loans, respectively.For multifamily properties, Fitch projects that bad debt expense from tenant nonpayment will exceed 10%.However, Fitch notes that its delinquency estimates do not consider forbearances.
- Fitch estimates that hotel loans with a pre-pandemic debt service coverage ratio (DSCR) of less than 2.75x on an interest-only basis are at risk of default.Guarantor support may limit the ultimate default rate, though.Retail and multifamily loans with a pre-pandemic DSCR of less than 1.75x and 1.20x, respectively, on an interest-only basis are at risk of default.Fitch did not apply any specific coronavirus stresses to office or industrial properties.5
- Among banks releasing industry exposures, Western Alliance Bancorp (WAL) reported the largest hotel concentration at 8.5% of total loans.Data provider STR reported a 79% year-over-year decline in revenue per available room for the week ended April 18, 2020, reflecting a 64% decline in occupancy (to 23%).6
- First Financial Bancorp (FFBC) reported the largest retail concentration among banks reporting such granular detail at 16% of total loans.Numerous other banks reported concentrations between 10% and 15% of total loans.7
Banks tend to be senior lenders in borrowers’ capital structure; thus, the rating agency data has somewhat limited applicability.Shadow lenders like business development companies and private credit lenders likely are more exposed than banks.Nevertheless, the data indicate that the rating agencies are expecting default and delinquency rates similar to the Great Financial Crisis.As for Camus’ narrator, the ultimate duration of the pandemic will determine when normality resumes.Lingering credit issues may persist, though, until well after the threat from COVID-19 recedes.
Conclusion
Community banks rightfully pride themselves as the lenders to America’s small business sector.These small businesses, though, often are more exposed to COVID-19 countermeasures and possess smaller buffers to absorb unexpected deterioration in business conditions relative to larger companies.Permanent changes in how businesses conduct operations and consumers behave will occur as new habits congeal.This leaves the community bank sector at risk.However, other factors support the industry’s ability to survive the turmoil:
- Extensive governmental responses such as the PPP loan program provide a lifeline to small businesses until conditions begin to recover.
- The industry enters this phase of the credit cycle with fewer apparent imbalances than prior to the Great Financial Crisis.
- A greater focus since the Great Financial Crisis on portfolio diversification and cash flow metrics proves that lessoned were learned.
- The smaller, more rural markets in which many community banks operate may prove more resilient, at least in the short term, than larger markets.
- Permissiveness from regulators regarding payment modifications will allow banks to respond sensitively to borrower distress.
Nonetheless, credit losses tend to be episodic for the industry, occurring between long stretches of low credit losses.The immediate issue remains how high this cycle’s losses go before returning to the normality that ensues in Hemingway and Camus’ work after war and pestilence.
1 Emmanuel Louis Bacani, “US Speculative-Grade Default Rate to Jump Toward Financial Crisis Peak – Moody’s,” S&P Global Market Intelligence, April 24, 2020
2 Fitch Ratings, U.S. LF/CLO Weekly, April 24, 2020.
3 Fitch Ratings, North American CMBS Market Trends, April 24, 2020.
4 Fitch Ratings, U.S. CMBS Delinquencies Projected to Approach Great Recession Peak Due to Coronavirus, April 9, 2020.
5 Fitch Ratings, Update on Response on Coronavirus Related Reviews for North American CMBS, April 13, 2020.
6 Jake Mooney and Robert Clark, “US Banks Detail Exposure to Reeling Hotel Industry in Q1 Filings,” S&P Global Market Intelligence, April 24, 2020
7 Tom Yeatts and Robert Clark, “First Financial, Pinnacle Rank Among Banks with Most Retail Exposure,” S&P Global Market Intelligence, April 27, 2020
Originally published in Bank Watch, April 2020.


