Corporate Valuation, Financial Services

June 4, 2019

Net Interest Margin Trends and Expectations

Since Bank Watch’s last review of net interest margin (“NIM”) trends in July 2016, the Federal Open Market Committee has raised the federal funds rate eight times after what was then the first rate hike (December 2015) since mid2006. With the past two years of rate hikes and current pause in Fed actions, it’s a good vantage point to look at the effect of interest rate movements on the NIM of small and large community banks (defined as banks with $100 million to $1 billion of assets and $1 billion to $10 billion of assets). As shown in Figure 1, NIMs crashed in the immediate aftermath of the financial crisis, primarily because asset yields fell much quicker than banks could reprice term deposits. NIMs subsequently rebounded as the asset refinancing wave subsided while banks were able to lower deposit rates. A several year period then occurred in which asset yields grinded lower at a time when deposit rates could not be reduced. This period was particularly tough for commercial banks with a high level of non-interest bearing deposits. Since rate hikes started, the NIM for both small and large community banks have increased about 20bps through year-end 2018 before experiencing some pressure in early 2019. The nine hikes by the Fed to a target funds rate of 2.25% to 2.50% amounts to a 225bps increase. 
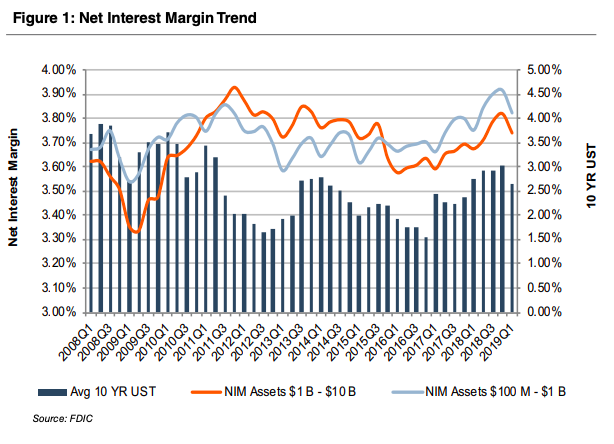
At first pass, the expansion in the NIMs is less than might be expected; however, there are always a number of factors in bank balance sheets that will impact the NIM, including:
  • Loan Floors. Many Libor- and prime-based commercial loans had floors that required 100-150bps of hikes before the floors were “out-of-the-money.”
  • Competition. Intense competition for loans in an environment in which bonds yielded very little resulted in pressure in the margin over a base rate as bank and non-bank lenders accepted lower margins in order to make loans.
  • Asset Mix. Community banks located in rural and semi-rural areas tend to have low loan-to-deposit ratios and, therefore, have not benefited as much as peers located in and around MSAs that are “loaned-up.” Nonetheless, net loans as a percentage of assets among community banks increased by an average of 15bps each quarter since year-end 2016 while bond portfolios declined.
  • Loan Mix. Community banks tend to have somewhat more of their loan portfolios allocated to residential mortgages and CRE than regional banks. As a result, it will take much longer for these mostly fixed-rate assets to reprice than Libor-based C&I portfolios.
  • Deposit COF. In recent quarters the marginal cost of funds (“COF”) has become expensive as depositors who came to accept being paid essentially nothing for their money began to demand more competitive rates once the Fed Funds rate approached 2%.
  • Deposit Mix. In addition to depositors demanding higher rates, a mix shift from non-interest bearing and very low-yielding transaction accounts into higher paying money markets and time deposits has pushed the COF higher, too, in recent quarters.

Fed to Cut Rates?

Recent incremental pressure on NIMs notwithstanding, community banks’ balance sheets were poised to take advantage of rising rates the past several years. The outperformance of bank stocks beginning in November 2016 reflected several factors, including an economic and regulatory backdrop that would allow the Fed to raise rates further and faster, and thereby support NIM expansion.

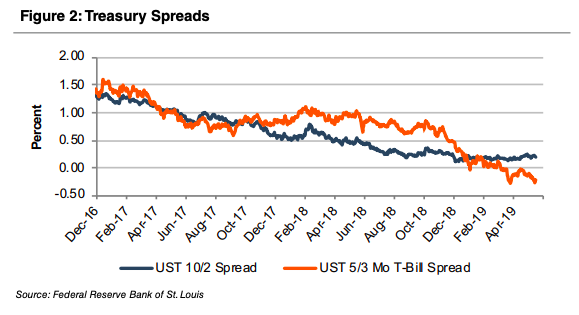
The underperformance of bank stocks since last fall reflects investor concern that this tailwind is ending in addition to more general concerns about what a possible economic slowdown implies for credit costs. Telltale signs include the inversion of the Treasury yield curve and yields on the two-year and five-year Treasuries that, as of the date of the drafting of this article, are below the low-end of the Fed Funds target range.

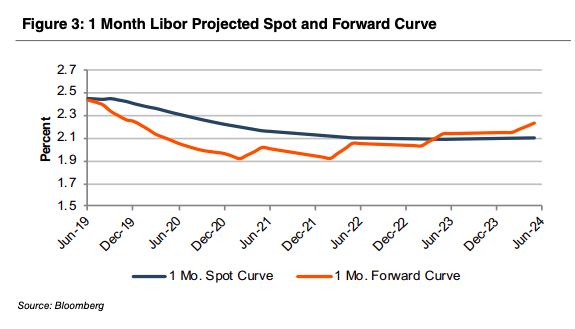
Also, the spot and forward curves for 30-day Libor imply the Fed will cut the Funds target rate and other short-term policy rates one or two times by early 2020 (or stated differently, the December rate hike was a mistake). The Federal Funds rate, the predominant influence on short-term interest rates, has remained unchanged since year-end 2018 at a target range of 2.25%–2.50% due to concerns about lower inflation figures and what they may forewarn about future economic growth as reflected in falling U.S. Treasury yields. The FOMC reiterated its wait-and-see approach on May 1. However, the sand appears to be shifting beneath the Fed’s feet. The Wall Street Journal’s most recent Economic Forecasting Survey revealed an increasing belief that the Fed’s next move will be to cut rates. 51% of respondents said that a rate cut would be the next move, up from 44% in April. 25.5% replied that the next rate raise would occur in 2020 or later. Fed officials have maintained their stance that a rate move in either direction will not occur soon.

The Importance of Deposits and Next Steps

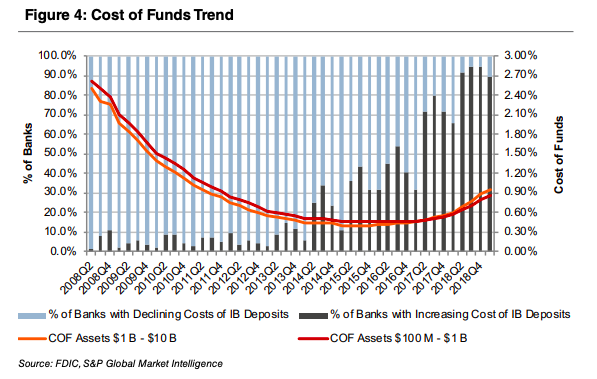
As deposit costs initially lagged, but more recently moved with short-term interest rate hikes, the composition of a bank’s deposit base and funding structure has become increasingly important. As shown in Figure 4, the percentage of banks experiencing a rising cost of interest bearing deposits has steadily increased. Total funding costs have nearly doubled since year-end 2016 as depositors have reoriented funds toward accounts offering higher rates. Banks searching for funding either must engage in intense deposit competition or tap into higher-cost sources such as wholesale funding.

Going forward community banks may face a modest reduction in NIMs because the yield curve is flat and the cost of incremental funding is expensive. Some community banks will choose to slow loan growth in order to protect margins; others will accept a lower margin. The predicament demonstrates yet again why deposit franchises are a key consideration for acquirers as banks with low cost deposit franchises and excess liquidity are particularly attractive in the current market. Originally published in Bank Watch, May 2019.

Continue Reading

April 2026 | The Community Bank Scale Tax: Three Questions for Boards in 2026
Bank Watch: April 2026

The Community Bank Scale Tax: Three Questions for Boards in 2026

Community banks came into 2026 in better shape than many expected. Margins and earnings improved, deposits were growing again, loan growth held up, and unrealized losses on securities moved lower. On the surface, the story looks better than a year ago. But that does not mean the pressure is gone.For many community banks, the next big issue is not only rates or loan growth. It is whether the bank is big enough, focused enough, and efficient enough to carry the higher cost of being a modern bank. That cost includes more than salaries and branches. It also includes technology, cybersecurity, vendor management, fraud tools, compliance, and the people needed to run it well. The FDIC’s Quarterly Banking Profile shows that despite better net interest margins, the largest drag on earnings is the cost of running a modern bank.That is where many board conversations should be headed now. The challenge is simple to describe: banking keeps getting more expensive, the cost base is harder to flex, and smaller banks do not always have enough scale to spread those costs out. This does not mean every bank needs to sell but it does mean every bank needs to be honest about what it costs to stay independent.1. Which costs are truly fixed, and which ones are self-inflicted?Every bank has unavoidable costs for non-revenue generating activities, such as for risk management, compliance, and cybersecurity. But not every cost deserves the same treatment.Some banks are carrying real fixed costs. Others are carrying years of built-up complexity: too many vendors, too many products, too many exceptions, too many legacy processes, and too many branches doing less work than they used to.The distinction between real fixed costs and the just-as-real complexity costs matters. If management treats every expense as untouchable, the bank usually ends up protecting complexity instead of protecting value. Boards should push on that point. Which costs are now part of the price of doing business? And which costs are there because nobody has made the harder cleanup decisions? Those are two very different problems.2. Are we big enough, or focused enough, to make the model work?Scale matters in banking, which is not a new point. The part that often gets missed is that scale does not always have to come from simply getting bigger. Scale can come from size. It can also come from focus.A bank with a strong niche, an efficient branch footprint, a manageable product set, and good expense discipline can often perform better than a larger bank carrying too much overhead. Bigger is not always better if the added size comes with added complexity.That is an important point for community bank boards. The question is not just, “Do we need to grow?” The better question is, “Do we have a business model that can carry the cost structure we have today?” If the answer is no, the bank has a few options: it can grow, it can simplify, it can narrow its focus, it can outsource more of what does not set it apart, or it can decide that another partner may be better positioned to carry the platform going forward.Recent examples show the range of choices. Community Bank used a branch purchase from Santander to build scale in a target market; Five Star Bank’s parent chose to wind down BaaS and refocus on its core franchise; Mechanics Bank exited indirect auto and later outsourced servicing of the run-off portfolio; and Susquehanna chose to partner with C&N for greater scale, resiliency, and efficiency. In sum, there are plenty of proven options and choices.But doing nothing is also a choice. And in many cases, it is the most expensive one.3. How much does the expense base hurt shareholder value?This is where strategy turns into valuation. A bank is not credited just for spending money on technology, compliance, or infrastructure. It gets credited when those investments lead to better performance, better returns, better customer retention, better growth, and better risk control.If the bank carries a heavy cost base without a clear payoff, that usually shows up in weaker earnings and lower returns. Over time, it can also show up in a lower valuation, which matters even if the board has no near-term interest in selling. Valuation is not just about a sale; it is a scorecard on the strength of the franchise. A bank with strong returns and a clear strategy usually has more flexibility. A bank with weaker returns and too much complexity usually has fewer options.Timing matters. Banks have more breathing room now than they did a few years ago when interest rates increased sharply, with strong earnings and clean asset quality, and that is a good time to revisit strategic and technological plans.The issue in 2026 is not simply whether a community bank can remain independent. The issue is whether it can earn that independence after paying the ever-growing cost of being a modern bank.The banks that will stand out are not necessarily the biggest banks. They are the ones that know what they do well, run a cleaner model, and make sure their cost base supports the franchise instead of weighing it down. For some institutions, that will support long-term independence. For others, it may lead to a different conclusion.Either way, the discussion should start with a hard look at the expense base. In a lot of cases, the pressure to sell does not begin with a buyer showing up. It begins when the math stops working.About Mercer CapitalMercer Capital is a nationally recognized valuation and advisory firm serving financial institutions including banks, credit unions, fintech companies, insurance companies, investment management firms, financial sponsors, and other specialty finance firms. Mercer Capital regularly assists these clients with significant corporate valuation requirements, transactional advisory services, and other strategic decisions.
March 2026 | Capital Allocation: The Strategic Decision in a Slower Growth Environment
Bank Watch: March 2026

Capital Allocation: The Strategic Decision in a Slower Growth Environment

Following several years of balance sheet volatility and margin pressure, the operating environment for banks improved in 2025 as most posted higher earnings on expanded net interest margins. The outlook for 2026, at least prior to the outbreak of the U.S./Israel-Iran war, reflects(ed) a relatively stable operating environment.Stability, however, introduces a different challenge. Loan growth has moderated across much of the industry, and the benefit from asset repricing has largely been realized. In this environment, earnings growth is less dependent on external tailwinds and more dependent on internal discipline. As a result, capital allocation has moved to the center of strategic decision-making.The Expanding Capital Allocation ToolkitCapital allocation discussions are often framed around dividends and, to a lesser extent, share repurchases. In practice, the range of capital deployment decisions is broader and more interconnected. Banks today are balancing:Organic balance sheet growthTechnology and infrastructure investmentDividendsShare repurchasesM&ABalance sheet repositioningRetained capital for flexibilityEach alternative carries different implications for risk, return, and long-term franchise value.Organic growth often is the preferred use for internally generated capital when the risk-adjusted returns exceed the cost of equity. However, competitive loan pricing and a tough environment to grow low cost deposits have narrowed spreads, reducing the margin for error. Similarly, technology investments may improve efficiency over time but require upfront capital with uncertain timing of returns.Returns, Valuation, and Market DisciplinePublic market valuations provide a useful lens for evaluating capital allocation decisions. As shown in Figure 1(on the next page), banks that generate higher returns on tangible common equity (ROTCE) tend to command higher price-to-tangible book value multiples. This can also be expressed algebraically, at least on paper, whereby P/E x ROTCE = P/TBV, while P/Es reflect investor assessments about growth and risk.This relationship reflects a straightforward principle: capital should be deployed where it earns returns in excess of the cost of equity. When internal opportunities meet that threshold, reinvestment should be appropriate. When returns are below the threshold, returning capital to shareholders through special dividends or repurchases may create greater per-share value.Share repurchases, in particular, can be an effective tool when executed below intrinsic value and when capital levels remain sufficient to support strategic flexibility. However, repurchases that do not improve per-share metrics or are offset by dilution from other sources may have limited impact.Figure 1: Publicly Traded Banks with Assets $1 to $5 BillionBalance Sheet Repositioning as Capital AllocationIn some cases, capital allocation decisions are embedded within the balance sheet itself. One example is securities portfolio repositioning.Many banks continue to hold securities originated during the low-rate environment of 2020 and 2021. While unrealized losses associated with these portfolios have moderated, the yield on these assets often remains well below current market rates.Repositioning the portfolio, by realizing losses and reinvesting at higher yields, represents a tradeoff between near-term capital impact and longer-term earnings improvement. In effect, this decision can be evaluated similarly to other capital deployment alternatives, with management weighing the upfront reduction in Tier 1 Capital against the expected lift to net interest income and returns over time.As with M&A, the concept of an “earnback period” can be applied. Institutions that approach repositioning with a clear understanding of the payback dynamics are better positioned to evaluate whether the strategy enhances long-term shareholder value. We offer the caveat that institutions who evaluate restructuring transactions should compare the expected return from realizing losses (i.e., reducing regulatory capital) with instead holding the securities and repurchasing shares. If the bank’s shares are sufficiently cheap, then it could make sense to continue to hold the underwater bonds until the shares rise sufficiently.M&A and Capital FlexibilityM&A remains a viable capital deployment option, particularly for institutions seeking scale or improved operating efficiency. However, transaction activity continues to be constrained by pricing discipline, tangible book value dilution, and investor expectations around earnback periods.Public market valuations ultimately serve as a governor on deal pricing, reinforcing the importance of aligning capital deployment decisions with shareholder return expectations.Conclusion: Discipline Drives OutcomesIn a slower growth environment, capital allocation is not a secondary consideration; it is a core driver of performance. While banks cannot control market multiples, they can control how capital is deployed across competing opportunities.Institutions that consistently allocate capital with a clear focus on risk-adjusted returns, strategic alignment, and per-share value creation are more likely to generate sustainable growth in earnings and tangible book value. In the current environment, disciplined execution may prove more valuable than more aggressive but less certain alternatives.
The Tariff Hangover: How a Year of Trade Volatility Is Reshaping Transportation
The past year has been defined by a series of rapid and often unpredictable shifts in trade policy. New tariffs, temporary pauses, retaliatory measures, and evolving global supply chains have left a measurable impact on the transportation and logistics industry. These developments have influenced freight volumes, pricing dynamics, capital allocation, and ultimately the valuation of transportation companies.

Cart

Your cart is empty