Medical Device Overview
The medical device manufacturing industry produces equipment designed to diagnose and treat patients within global healthcare systems. Medical devices range from simple tongue depressors and bandages, to complex programmable pacemakers and sophisticated imaging systems. Major product categories include surgical implants and instruments, medical supplies, electro-medical equipment, in-vitro diagnostic equipment and reagents, irradiation apparatuses, and dental goods.
The following outlines five structural factors and trends that influence demand and supply of medical devices and related procedures.
1. Demographics
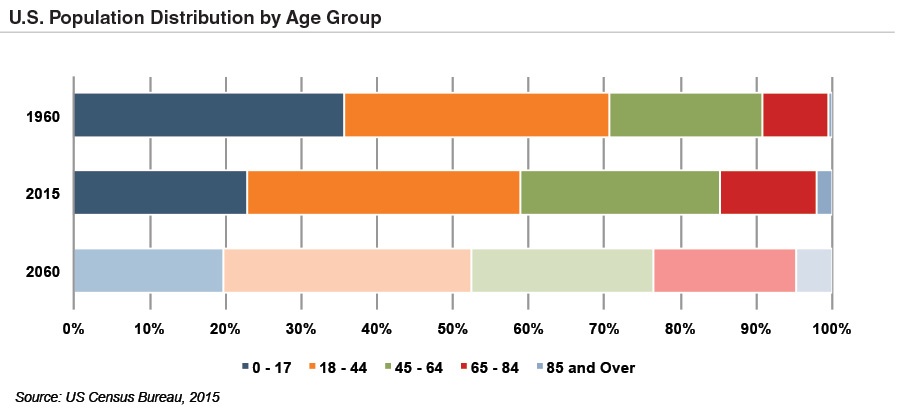
The aging population, driven by declining fertility rates and increasing life expectancy, represents a major demand driver for medical devices. The U.S. elderly population (persons 65 and above) totaled 48 million in 2015 (15% of the population). The U.S. Census Bureau estimates that the elderly will roughly double by 2060 to 98 million, representing 24% of the total U.S. population.
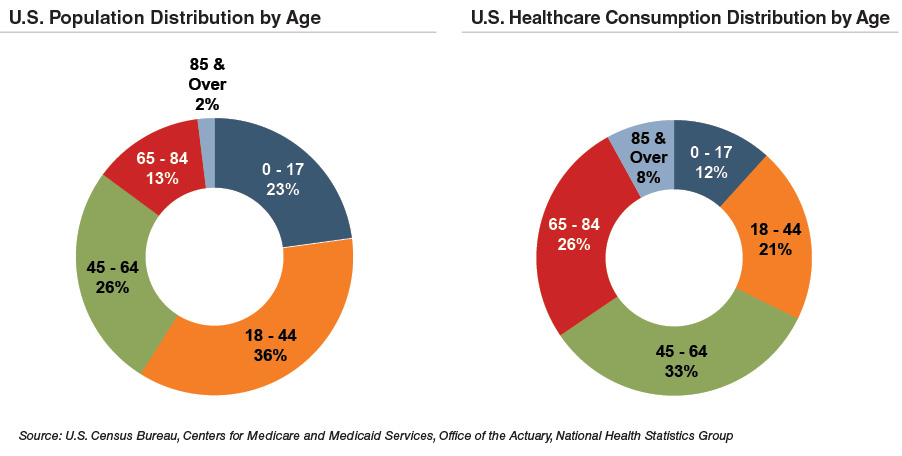
The elderly account for nearly one third of total healthcare consumption. Personal healthcare spendingfor the 65 and above population segment was $19,000 per person in 2012, five times the spending per child ($3,600) and almost triple the spending per working-age person ($6,600).
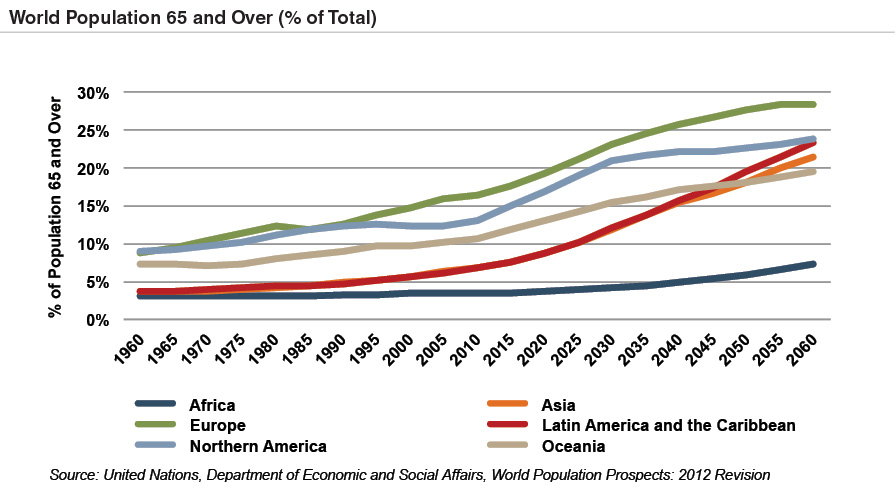
According to United Nations projections, the global elderly population will rise from 608 million (8.3% of world population) in 2015 to 1.8 billion (18.1% of world population) in 2060. Europe’s elderly are projected to reach 28% of the population by 2060, making it the world’s oldest region. While Latin America and Asia are currently relatively young, these regions are expected to experience drastic transformations over the next several decades, with the over 65 population segments expected to expand from 8% in 2015 to more than 23% of the total population by 2060.
2. Healthcare Spending and the Legislative Landscape in the U.S.
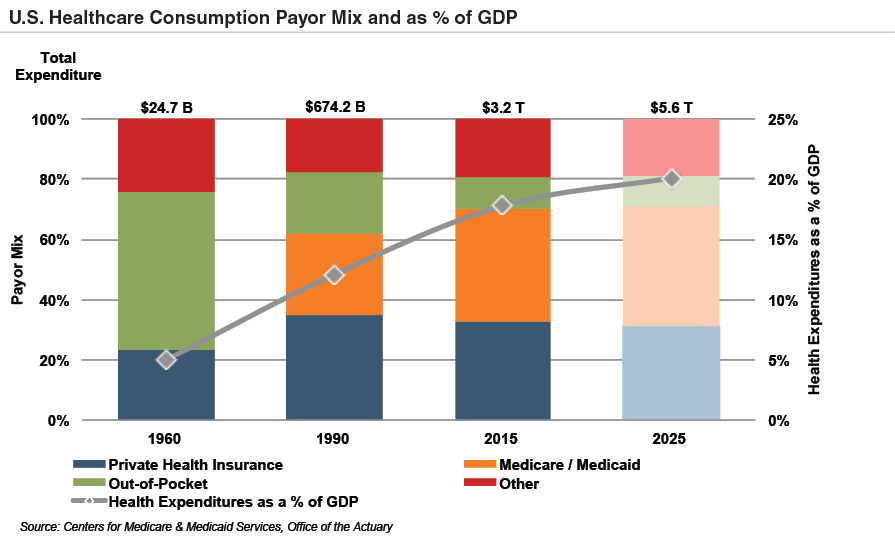
Demographic shifts underlie the expected growth in total U.S. healthcare expenditure from $3.2 trillion in 2015 to $5.6 trillion in 2025. Healthcare spending as a percentage of GDP is also expected to expand from 17% in 2015 to over 20% by 2025.
Since inception, Medicare has accounted for an increasing proportion of total U.S. healthcare expenditures. Medicare currently provides healthcare benefits for an estimated 57 million elderly and disabled Americans, constituting approximately 15% of the federal budget in 2015. Medicare represents the largest portion of total healthcare costs, constituting 20% of total health spending in 2014. Medicare also accounts for 26% of hospital spending, 29% of retail prescription drugs sales, and 23% of physician services.
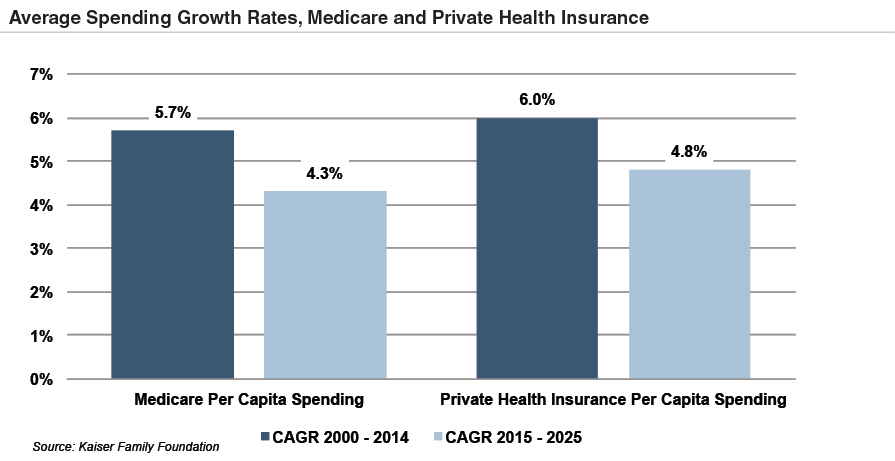
Owing to the growing influence of Medicare in aggregate healthcare consumption, legislative developments can have a potentially outsized effect on the demand and pricing for medical products and services. Netoutlays to the four parts of Medicare totaled $540 billion in 2015, and spending is expected to reach $709 billion by 2020. Between 2000 and 2010, growth in Medicare spending per capita was comparable or lower than private health insurance spending. The Patient Protection and Affordable Care Act (“ACA”) of 2010 incorporated changes that are expected to constrain annual growth in Medicare spending over the next several decades by curtailing increases in Medicare payments to healthcare providers, and establishing several new policies and programs designed to reduce costs.
On a per person basis, Medicare spending is projected to grow at 4.3% annually from 2015 and 2025, compared to 5.7% average annualized growth realized from 2000 to 2014. As part of ACA legislation, a 2.3% excise tax was imposed on certain medical devices for sales by manufacturers, producers, or importers. The 2.3% levy was expected to net nearly $30 billion over a decade into the early 2020s. The tax became effective on December 31, 2012, but met resistance from industry participants and policy makers. In July of 2015, the U.S. House of Representatives voted to repeal the medical device tax. In late 2015, Congress passed legislation promulgatinga two-year moratorium on the tax beginning January 2016.
3. Third-Party Coverage and Reimbursement
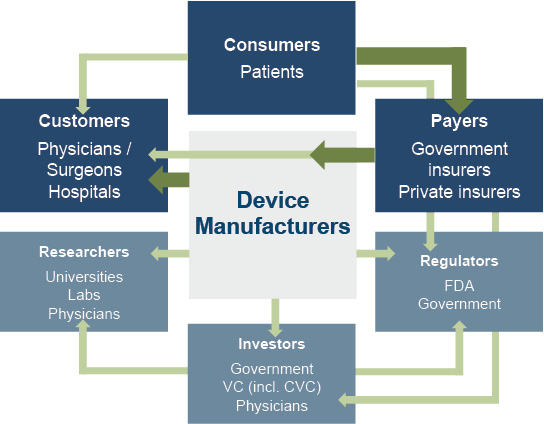
The primary customers of medical device companies are physicians (and/or product approval committees at their hospitals), who select the appropriate equipment for consumers (the patients). In most developed economies, the consumers themselves are one (or more) step removed from interactions with manufacturers, and therefore pricing of medical devices. Device manufacturers typically receive payments from insurers, who usually reimburse healthcare providers for routine procedures (rather than for specific components like the devices used). Accordingly, medical device purchasing decisions tend to be largely disconnected from price.
Third-party payors (both private and government programs) are keen to reevaluate their payment policies to constrain rising healthcare costs. Several elements of the ACA are expected to limit reimbursement growth for hospitals, which form the largest market for medical devices. Lower reimbursement growth will likely persuade hospitals to scrutinize medical purchases by adopting i) higher standards to evaluate the benefits of new procedures and devices, and ii) a more disciplined price bargaining stance.
The transition of the healthcare delivery paradigm from fee-for-service (FFS) to value models is expected to lead to fewer hospital admissions and procedures, given the focus on cost-cutting and efficiency. In 2015, the Department of Health and Human Services (HHS) announced goals to have 85% and 90% of all Medicare payments tied to quality or value by 2016 and 2018, respectively, and 30% and 50% of total Medicare payments tied to alternative payment models by the end of 2016 and 2018, respectively. In March 2016, the HHS estimated 30% of Medicare payments were tied to alternative, value-based models, nearly one yearahead of schedule. Ultimately, lower reimbursement rates and reduced procedure volume will likely limit pricing gains for medical devices and equipment.
The medical device industry faces similar reimbursement issues globally. A number of countries have instituted price ceilings on certain medical procedures, which could deflate the reimbursement rates of third-party payors, forcing down industry product prices. Whether third-party payors consider certain devices medically reasonable or necessary for operations presents a hurdle that device makers and manufacturers must overcome in bringing their devices to market.
4. Competitive Factors and Regulatory Regime
Historically, much of the growth for medical technology companies has been predicated on continual product innovations that make devices easier for doctors to use and improve health outcomes for the patients. Successful product development usually requires significant R&D outlays and a measure of luck. However, viable new devices can elevate average selling prices, market penetration, and market share.
Government regulations curb competition in two ways to foster an environment where firms may realize an acceptable level of returns on their R&D investments. First, firms that are first to the market with a new product can benefit from patents and intellectual property protection giving them a competitive advantage for a finite period. Second, regulations govern medical device design and development, preclinical and clinical testing, premarket clearance or approval, registration and listing, manufacturing, labeling, storage, advertising and promotions, sales and distribution, export and import, and post market surveillance.
Regulatory Overview in the U.S.
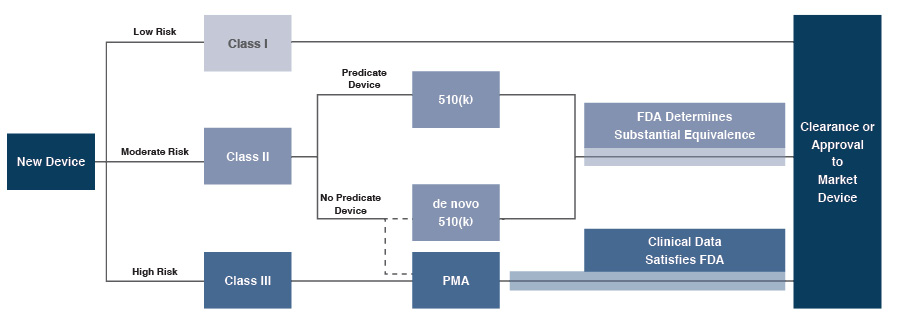
In the U.S., the FDA generally oversees the implementation of the second set of regulations. Some relatively simple devices deemed to pose low risk are exempt from the FDA’s clearance requirement and can be marketed in the U.S. without prior authorization. For the remaining devices, commercial distribution requires marketing authorization from the FDA, which comes in primarily two flavors.
The premarket notification (“510(k) clearance”) process requires the manufacturer to demonstrate that a device is “substantially equivalent” to an existing device that is legally marketed in the U.S. The 510(k) clearance process may occasionally require clinical data, and generally takes between 90 days and one year for completion.
The premarket approval (“PMA”) process is more stringent, time-consuming and expensive. A PMA application must be supported by valid scientific evidence, which typically entails collection of extensive technical, preclinical, clinical and manufacturing data. Once the PMA is submitted and found to be complete, the FDA begins an in-depth re- view, which is required by statute to take no longer than 180 days. However, the process typically takes significantly longer, and may require several years to complete.
Pursuant to the Medical Device User Fee Modernization Act (MDUFA), the FDA collects user fees for the review of devices for marketing clearance or approval, as well as establishment registration. The current iteration of the act, MDUFA III, was enacted in 2012 and expected to collect approximately $400 million in user fees over five years. The FDA and the medical device industry have reached a broad agreement on the outlines of the next iteration. The FDA is expected to collect nearly $1 billion in user fees over five years pursuant to MDUFA IV, which would go into effect in in October 2017.
Regulatory Overview Outside the U.S.
The European Union (EU), along with countries such as Japan, Canada, and Australia all operate strict regulatory regimes similar to that of the U.S. FDA, and international consensus is moving towards more stringent regulations. Stricter regulations for new devices may slow release dates and may negatively affect companies within the industry.
Medical device manufacturers face a single regulatory body across the EU, the Company’s second largest end market behind the U.S. In order for a medical device to be allowed on the market, it must meet the requirements set by the EU Medical Devices Directive. Devices must receive a Conformité Européenne (CE) Mark certificate before they are allowed to be sold on the market. This CE marking verifies that a device meets all regulatory requirements for the EU, and that they meet EU safety standards. A set of different directives apply to different types of devices, and the device must be compliant with the directive that purviews it.
5. Emerging Global Markets
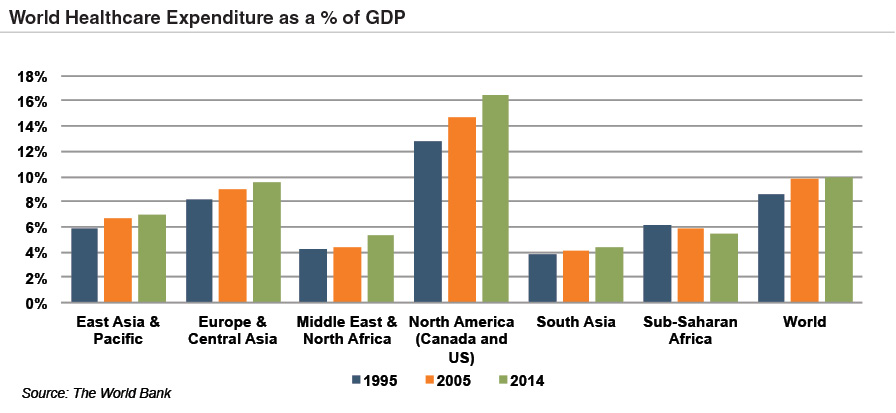
Emerging economies are claiming a growing share of global healthcare consumption, including medical devices and related procedures, owing to relative economic prosperity, growing medical awareness, and increasing (and increasingly aging) populations. As global health expenditure continues to increase, sales to countries outside the U.S. represent a potential avenue for growth for domestic medical device companies. According to the World Bank, all regions (except Sub-Saharan Africa) have seen an increase in healthcare spending as a percentage of total output over the last two decades.
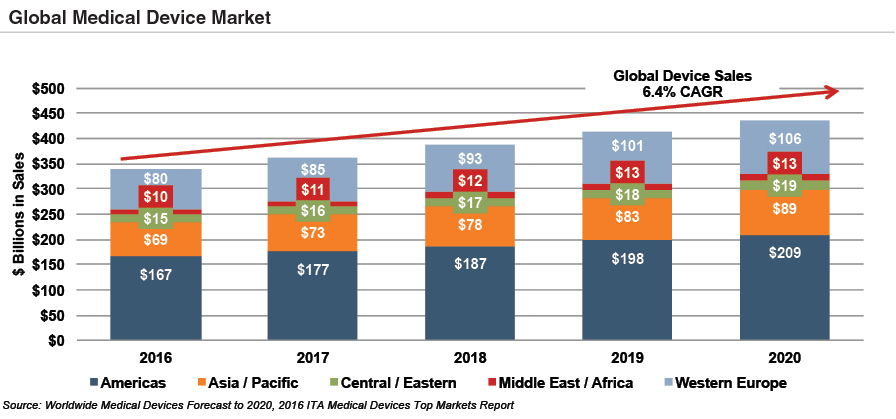
Global medical devices sales are estimated to increase 6.4% annually from 2016 to 2020, reaching nearly $440 billion according to the International Trade Administration. While the Americas are projected to remain the world’s largest medical device market, the Asia and Pacific and Western Europe markets are expected to expand at a quicker pace over the next several years.
Summary
Demographic shifts underlie the long-term market opportunity for medical device manufacturers. While efforts to control costs on the part of the government insurer in the U.S. may limit future pricing growth for incumbent products, a growing global market provides domestic device manufacturers with an opportunity to broaden and diversify their geographic revenue base. Developing new products and procedures is risky and usually more resource intensive compared to some other growth sectors of the economy. However, barriers to entry in the form of existing regulations provide a measure of relief from competition, especially for newly developed products.