Statistics can be deceptive. The bank M&A market in 2015 could be described as steady, bereft of any blockbuster deals. According to SNL Financial 287 depositories (253 commercial banks and 34 thrifts) agreed to be acquired in 2015 compared to 304 in 2014 and 246 in 2013. Since 1990, the peak in M&A transactions occurred in 1994 (566) followed by 1998 (504). For those who do not remember, 1998 was the blockbuster year when NationsBank/Bank of America, Norwest/Wells Fargo, Bank One/First Chicago NBD and SunTrust Banks/Crestar Financial among others agreed to merge (Figure 1).
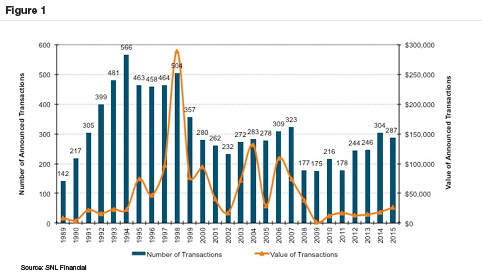 There has been a cumulative impact of M&A activity over the years. As of September 30, 2015, there were 6,270 insured depositories compared to about 18,000 institutions in 1985 when interstate banking laws were liberalized. M&A activity when measured by the number of transactions obviously has declined; however, that is not true on a relative basis. Since 1990, the number of institutions that agreed to be acquired in non-assisted deals ranged between 1.4% (1990) and 4.6% (1998) with an overall median of 3.2%. Last year was an active year by this measure, with 4.4% of the industry absorbed, as was 2013 (4.5%).
What accounts for the activity? The most important factors we see are (a) good asset quality; (b) currency strength for many publicly traded buyers; (c) very low borrowing costs; (d) excess capital among buyers; and (e) ongoing earnings pressure due to heightened regulatory costs and very low interest rates. Two of these factors were important during the 1990s. Asset quality dramatically improved following the 1990 recession while valuations of publicly traded banks trended higher through mid-1998 as M&A fever came to dominate investor psychology.
Today the majority of M&A activity involves sellers with $100 million to $1 billion of assets. According to the FDIC non-current loans and ORE for this group declined to 1.20% of assets as of September 30 from 1.58% in 2014. The most active subset of publicly traded banks that constitute acquirers is “small cap” banks. The SNL Small Cap U.S. Bank Index rose 9.2% during 2015 and finished the year trading for 17x trailing 12 month earnings. By way of comparison, SNL’s Large Cap U.S. Bank Index declined 1.3% and traded for 12x earnings. Strong acquisition currencies and few(er) problem assets of would-be sellers are a potent combination for deal making.
Earnings pressure due to both the low level of rates (vs. the shape of the yield curve) and post-crisis regulatory burdens are industry-wide issues. Small banks do not have any viable means to offset the pressure absent becoming an acquirer to gain efficiencies or elect to sell. Many chose the latter. The Fed may have nudged a few more boards to make the decision to sell by delaying the decision to raise short rates until December rather than June or September when the market expected it to do so. “Lift-off” and the attendant lift in NIMs may prove to be a non-starter if the Fed is on a path to a one-done rate hike cycle.
As shown in Figure 2, pricing in terms of the average price/tangible book multiple increased nominally to 142% in 2015 from 139% in 2014. The more notable improvement occurred in 2014 when compared to 2013 and 2012, which is not surprising given the sharp drop in NPAs during 2011-2013. The median P/E multiple was 24x, down from 28x in 2014 and comparable to 23x in 2013. The lower P/E multiple reflected the somewhat better earnings of sellers in which pricing was reported with a median ROA of 0.65% compared to 0.55% in 2014. Although the data is somewhat murky, we believe acquirers typically pay on the order of 10-13x core earnings plus fully-phased-in, after-tax expense savings.
There has been a cumulative impact of M&A activity over the years. As of September 30, 2015, there were 6,270 insured depositories compared to about 18,000 institutions in 1985 when interstate banking laws were liberalized. M&A activity when measured by the number of transactions obviously has declined; however, that is not true on a relative basis. Since 1990, the number of institutions that agreed to be acquired in non-assisted deals ranged between 1.4% (1990) and 4.6% (1998) with an overall median of 3.2%. Last year was an active year by this measure, with 4.4% of the industry absorbed, as was 2013 (4.5%).
What accounts for the activity? The most important factors we see are (a) good asset quality; (b) currency strength for many publicly traded buyers; (c) very low borrowing costs; (d) excess capital among buyers; and (e) ongoing earnings pressure due to heightened regulatory costs and very low interest rates. Two of these factors were important during the 1990s. Asset quality dramatically improved following the 1990 recession while valuations of publicly traded banks trended higher through mid-1998 as M&A fever came to dominate investor psychology.
Today the majority of M&A activity involves sellers with $100 million to $1 billion of assets. According to the FDIC non-current loans and ORE for this group declined to 1.20% of assets as of September 30 from 1.58% in 2014. The most active subset of publicly traded banks that constitute acquirers is “small cap” banks. The SNL Small Cap U.S. Bank Index rose 9.2% during 2015 and finished the year trading for 17x trailing 12 month earnings. By way of comparison, SNL’s Large Cap U.S. Bank Index declined 1.3% and traded for 12x earnings. Strong acquisition currencies and few(er) problem assets of would-be sellers are a potent combination for deal making.
Earnings pressure due to both the low level of rates (vs. the shape of the yield curve) and post-crisis regulatory burdens are industry-wide issues. Small banks do not have any viable means to offset the pressure absent becoming an acquirer to gain efficiencies or elect to sell. Many chose the latter. The Fed may have nudged a few more boards to make the decision to sell by delaying the decision to raise short rates until December rather than June or September when the market expected it to do so. “Lift-off” and the attendant lift in NIMs may prove to be a non-starter if the Fed is on a path to a one-done rate hike cycle.
As shown in Figure 2, pricing in terms of the average price/tangible book multiple increased nominally to 142% in 2015 from 139% in 2014. The more notable improvement occurred in 2014 when compared to 2013 and 2012, which is not surprising given the sharp drop in NPAs during 2011-2013. The median P/E multiple was 24x, down from 28x in 2014 and comparable to 23x in 2013. The lower P/E multiple reflected the somewhat better earnings of sellers in which pricing was reported with a median ROA of 0.65% compared to 0.55% in 2014. Although the data is somewhat murky, we believe acquirers typically pay on the order of 10-13x core earnings plus fully-phased-in, after-tax expense savings.
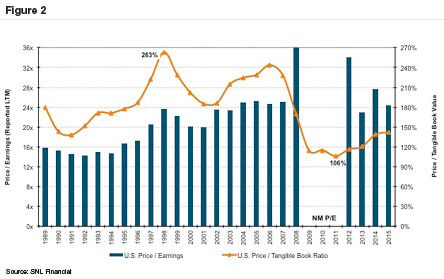 Figure 3 provides perspective on pricing based upon size and profitability as measured by LTM ROE. Not surprisingly, larger and more profitable companies obtained better pricing in terms of the P/TBV ratio; however, as profitability increases the P/E multiple tends to decline. That is not surprising because a higher earning bank should have fewer issues that depress current earnings.
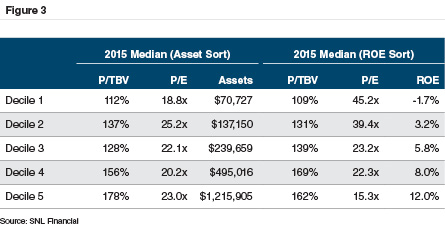
The other notable development in 2015 was the return of non-SIFI large banks to the M&A market after largely being absent since the financial crisis as management and regulators sorted through the changes that the Dodd-Frank Act mandated. BB&T Corporation, which is among the very best acquirers, followed-up its 2014 acquisitions for Bank of Kentucky Financial Corp. and Susquehanna Bancshares with an agreement to acquire Pennsylvania-based National Penn Bancshares. The three transactions added about $30 billion of assets to an existing base of about $180 billion. Other notable deals included KeyCorp agreeing to acquire First Niagara ($39 billion) and Royal Bank of Canada agreeing to acquire City National Corporation ($32 billion). Also, M&T Bancorp was granted approval by the Federal Reserve to acquire Hudson City Bancorp ($44 billion) three years after announcing the transaction.
To get a sense as to how the world has changed, consider that the ten largest transactions in 2015 accounted for $17 billion of the $26 billion of transaction value compared to $9 billion of $19 billion in 2014. The amounts are miniscule compared to 1998 when the ten largest transactions accounted for $254 billion of $289 billion of announced deals that year.
Law firm Wachtell, Lipton, Rosen & Katz (“Wachtell”) noted that with the approval of several large deals this year there is more certainty to the regulatory approval process and there is no policy to impede bank mergers x-the SIFI banks. A key threshold for would-be sellers and would-be buyers from a decision process has been $10 billion of assets (and $50 billion) given enhanced regulatory oversight and debit card interchange fee limitation that applies for institutions over $10 billion. Wachtell cited the threshold as an important consideration for National Penn’s board in its decision to sell to BB&T.
There were a couple of other nuances to note. While not always true, publicly-traded buyers did not receive the same degree of “pop” in their share prices when a transaction was announced as was the case in 2012 and 2013. The pops were unusual because buyers’ share prices typically are flat to lower on the news of an announcement. Several years ago the market view was that buyers were acquiring “growth” in a no-growth environment and were likely acquiring banks whose asset quality problems would soon fade.
Also, the rebound in real estate values and resumption of pronounced migration in the U.S. to warmer climates facilitated a pick-up in M&A activity in states such as Georgia (11 deals) and the perennial land of opportunity and periodic busts—Florida (21). The recovery in the banking sector in once troubled Illinois was reflected in 25 transactions followed by 20 in California.
As 2016 gets underway, pronounced weakness in equity and corporate bond markets if sustained will cause deal activity to slow. Exchange ratios are hard to set when share prices are volatile, and boards of sellers have a hard time accepting a lower nominal price when the buyer’s shares have fallen. Debt financing that has been readily available may be tougher to obtain this year if the market remains unsettled.
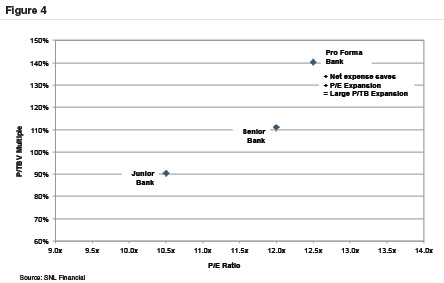
Whether selling or merging, we note for the surviving entity a key goal should be something akin to Figure 4 in which there is shared upside for both the acquirer’s and seller’s shareholders (assuming a merger structured as a share exchange). A well-structured and well-executed transaction can improve the pro forma bank’s profitability and growth prospects. If so, all shareholders may benefit not only from EPS accretion, but also multiple expansion.
 We at Mercer Capital have over 30 years of experience of working with banks to assess transactions, ranging from valuation to issuing fairness opinions in addition to helping assess the strategic position (e.g., sell now vs. sell later). Please call if we can help your institution evaluate a significant corporate transaction.


